Assessing the sensitivity of common plant species from historical data
Authors: C. Picard, A. Kirkwood and J. Schwalbe
Non-target terrestrial plant (NTTP) studies are used to assess the potential effects of crop protection agrochemicals, known as plant protection products (PPP), on seedling emergence and vegetative vigor grown under controlled greenhouse conditions. Seedling emergence studies assess the exposure effects on germination and growth in accordance with the OECD 208 Terrestrial Plant Test: Seedling Emergence and Seedling Growth Test or U.S. EPA 850.4100 Seedling Emergence and Seedling Growth guideline. Vegetative vigor studies assess the exposure effects on young plants in accordance with the OECD 227 Terrestrial Plant Test: Vegetative Vigour Test or US EPA 850.4150 Vegetative Vigor guideline. These studies are used to assess the risk of undesirable effects to off-field plant communities due to the application of PPP to arable land.
Depending on the regulatory objective, these studies often require defining a no observed effect rate or various effective concentration (EC
x) values and may include testing up to 10 species of common plants. The inherent variability in this testing coupled with other challenges (hormesis, frequent shallow dose responses, lack of standardization for replication, or planting density) presents significant issues in conducting this testing and interpreting the data. In NTTP, inherent variability can be defined as differences in measured parameters (emergence, growth, etc.) as a function of biological variability rather than true toxicity effects. While increasing replication or testing additional application rates can increase the statistical power of these tests, this is often not feasible due to the resources required to conduct larger studies.
The sensitivity analysis was conducted by harvesting relevant information from our extensive historical database for seedling emergence and vegetative vigor studies. Tomato most frequently generated the lowest reported endpoint for studies while incidences in which no effects were observed represented 84% of the ANOVA comparisons. The percent minimum significant difference (PMSD) was not a clear indicator of sensitivity with regards to toxic effects and no clear trends were observed across compound classes or modes of action.
Accessing historical data
Since Smithers typically conducts standard studies according to specific guidelines and under confidentiality agreements with our clients, we rarely have the opportunity to publish the results of individual studies. However, from our robust set of historical testing data related to several test types, we are often able to perform retrospective queries, extract the data, and interpret that information to guide the optimization of existing test methods.
In this instance, we compiled endpoint data from 32 seedling emergence and 25
vegetative vigor studies, surveyed species sensitivity by the lowest reported endpoint for each test type, across compound class, and by mode of action. Finally, we assessed the sublethal endpoint Percent Minimum Significant Difference (PMSD) for each species across test types.
How the tests were performed
The studies included testing up to 10 species of common plants, measuring both lethal and non-lethal endpoints to generate dose-response data with EC
25, no‐observed‐effect concentration (NOEC), and lowest-observed-effect concentration (LOEC). Studies were conducted in accordance with the relevant EPA and OECD guidance.
Interpreting the results
Data mining consisted of assessing our most recent plant testing data. A database was designed to include some of the following components: test material, compound class, test type, species tested, units for application rate, and the various endpoints required for testing. The relevant data was then extracted from study reports and added to the database for assessment. The following figure summarizes the completed database as it relates to the statistical endpoints.
| |
NOEC/LOEC |
EC25 |
No Effect |
| Seedling Emergence |
942 |
99 |
823 |
| Vegetative Vigor |
691 |
127 |
541 |
| Total |
1633 |
226 |
1364 |
Figure 1: Number and type of endpoint data included in this assessment. The no effect values encountered were based on one-way ANOVA comparisons for each species. The number of EC25 values generated was low related to the complete data set as in many cases a 25% reduction in the given endpoint was not observed.
Assessing sensitivity
The database was assessed for each test type (seedling emergence and vegetative vigor). Species that had the lowest reported endpoint for each test were identified and comparisons were made across compound classes and modes of action (for herbicides only). For sublethal endpoints such as dry weight and length, PMSD values were plotted for each species and test type. These values were used to determine if statistical sensitivity using PMSD as a proxy was related to true sensitivity in terms of toxicity.


Figure 2: Frequency distribution comparing individual species sensitivity for complete seedling emergence and vegetative vigor data sets.
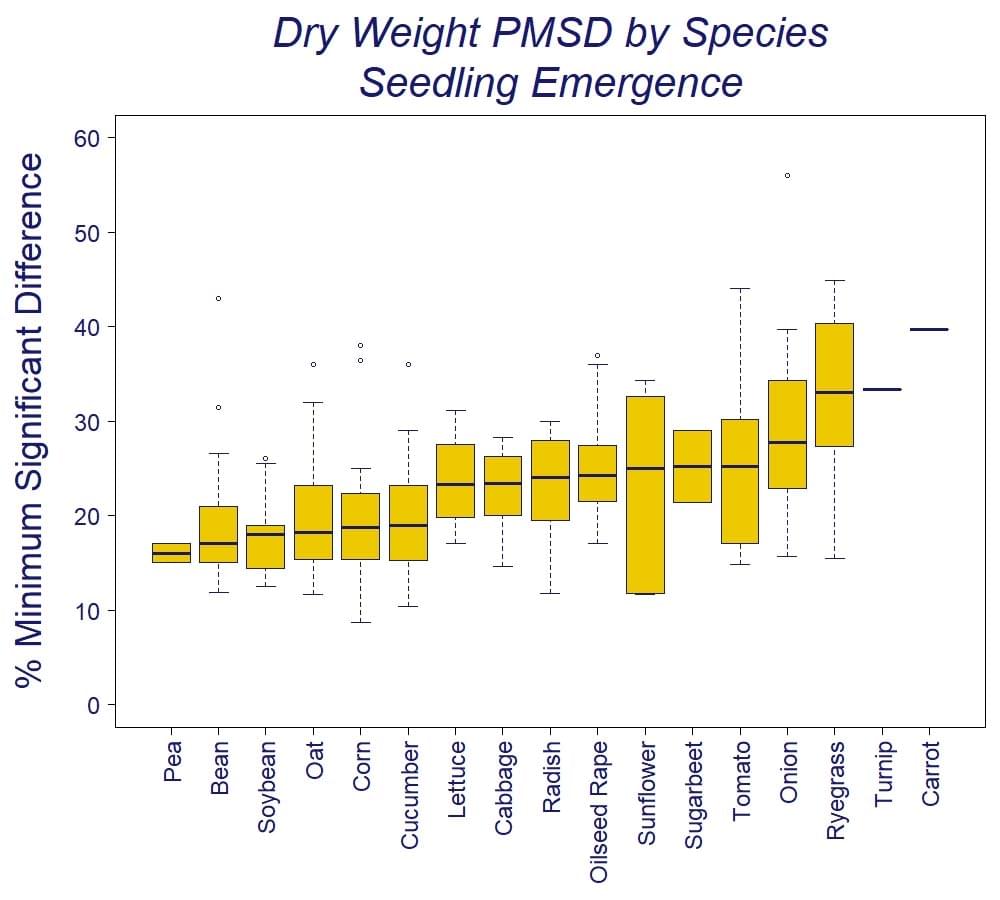
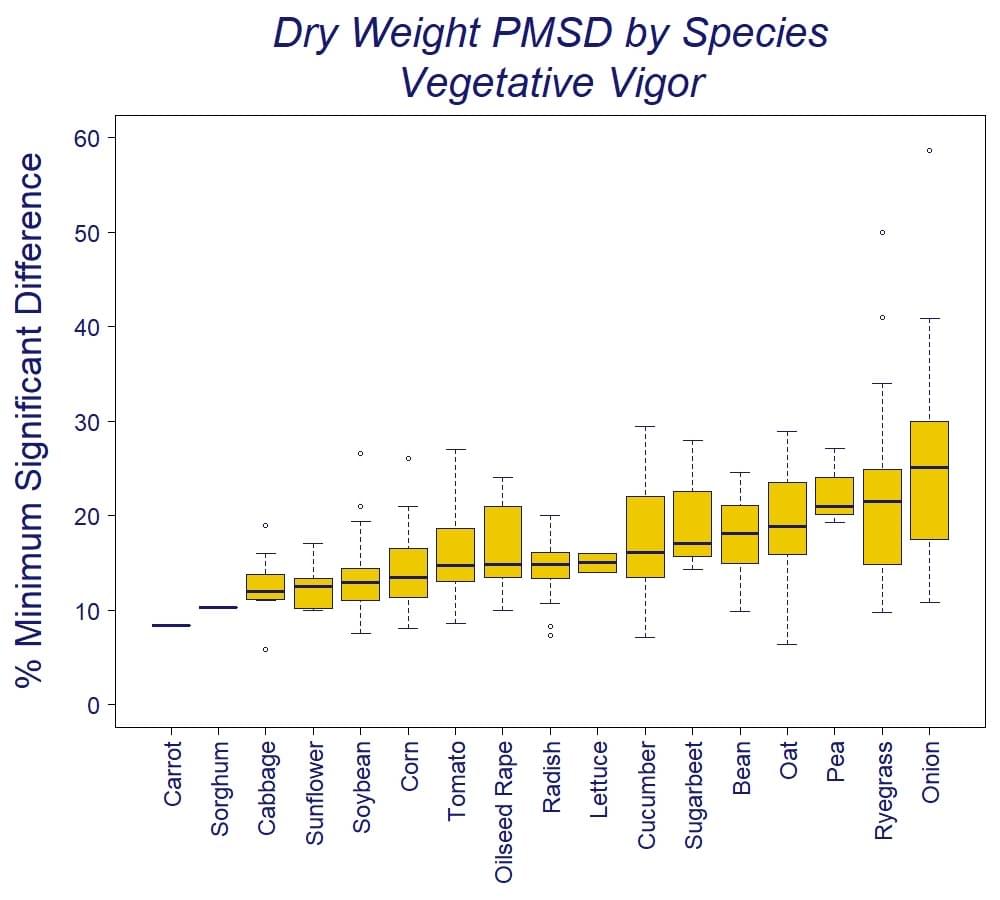
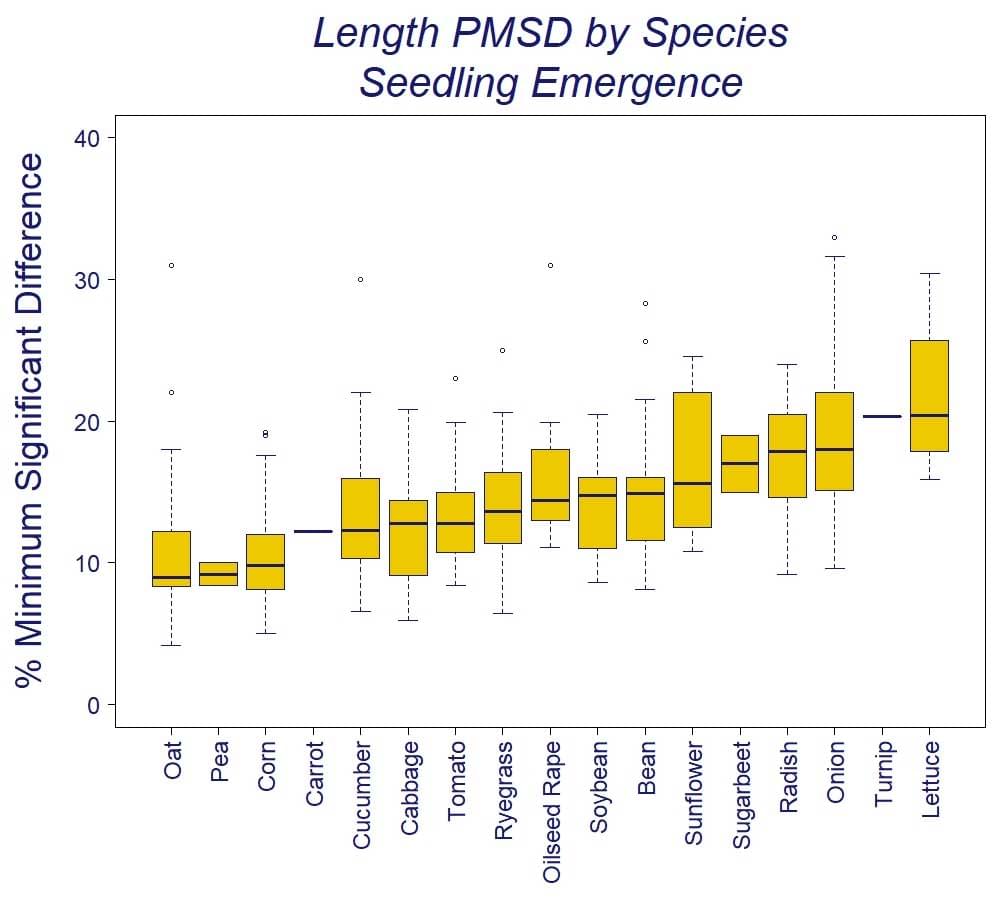
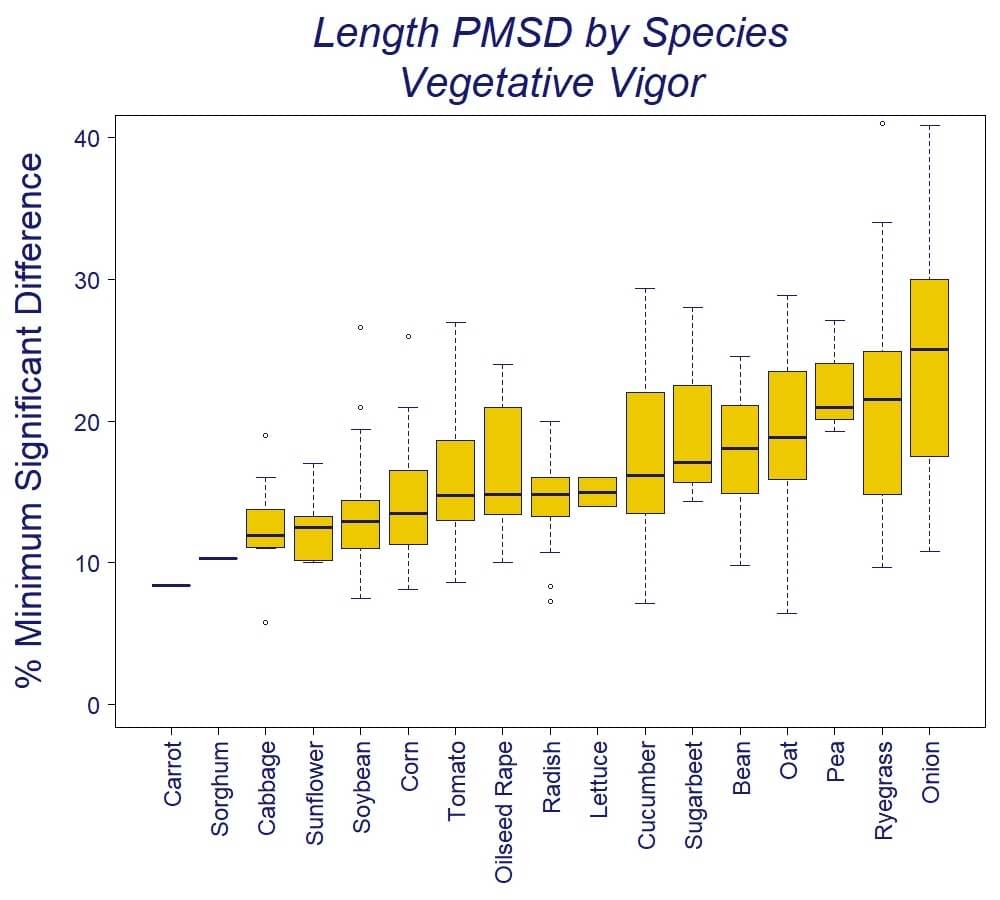
Figure 3: Box and whisker plots of PMSD data for sublethal endpoints in seedling emergence and vegetative vigor data sets. The boxes represent the median and 25th and 75th percentiles, whereas whiskers represent the maximum and minimum values. Open circles represent outliers.
Drawing conclusions
Our analysis of historical data demonstrated that tomato is most sensitive of commonly used species. In both seedling emergence and vegetative vigor tests, tomato most frequently generated the lowest endpoint. Although there were no clear sensitivity trends across compound classes or modes of action, plants that share a similar vine-like morphology (tomato, bean, and cucumber) showed a clearly higher sensitivity. Consequently, plant morphology may be an important factor in accurately measuring growth thus effecting sensitivity. Furthermore, PMSD was not a clear indicator of sensitivity, suggesting a difference in statistical sensitivity and true toxicity. No effect outcomes were common for the data set examined and observed for 84% of the total ANOVA endpoints.
Translating results into practice
Smithers’ ability to interpret historical data, whether in terms of endpoint sensitivity or control performance, and apply it to testing design or optimization is essential to stay at the forefront of
ecotoxicology testing. By re-examining existing data pools related to different types of testing, we can develop best practices and submit suggestions to regulatory agencies and colleagues in the
agroscience industry to help minimize the variability of testing practices.